So over in (Ai image generation) Remote Setup I was looking at the optimal cost per image setup. Because I love data so much I decided to go ahead and document how I got the values in the table.
I did this by looking at this Tom’s Hardware article where they gave a benchmark of images per minute on a few different GPU’s. I manually copied the values for the 512 x 512 image generation into a CSV file.
For the vast.ai data I found that their API call will return every machine if you don’t put on any filters (don’t even need any headers!) So I download that and ended up with an 8 MB JSON file.
I currently have this fascination with DuckDB. It originally started with SQLite, but moved on to DuckDB as I prefer using it for analysis rather than actual storage. If you didn’t know, DuckDB can natively consume JSON files.
So I fired up DuckDB and ran the following:
SELECT * FROM 'vastai.json';This yielded a table with one column and one row…

This is because everything is underneath a single offers entry:
{
	"offers": [
		{ "entry1" : ...},
		{ "entry2" : ...},
		{ "entryN" : ...},
	]
}
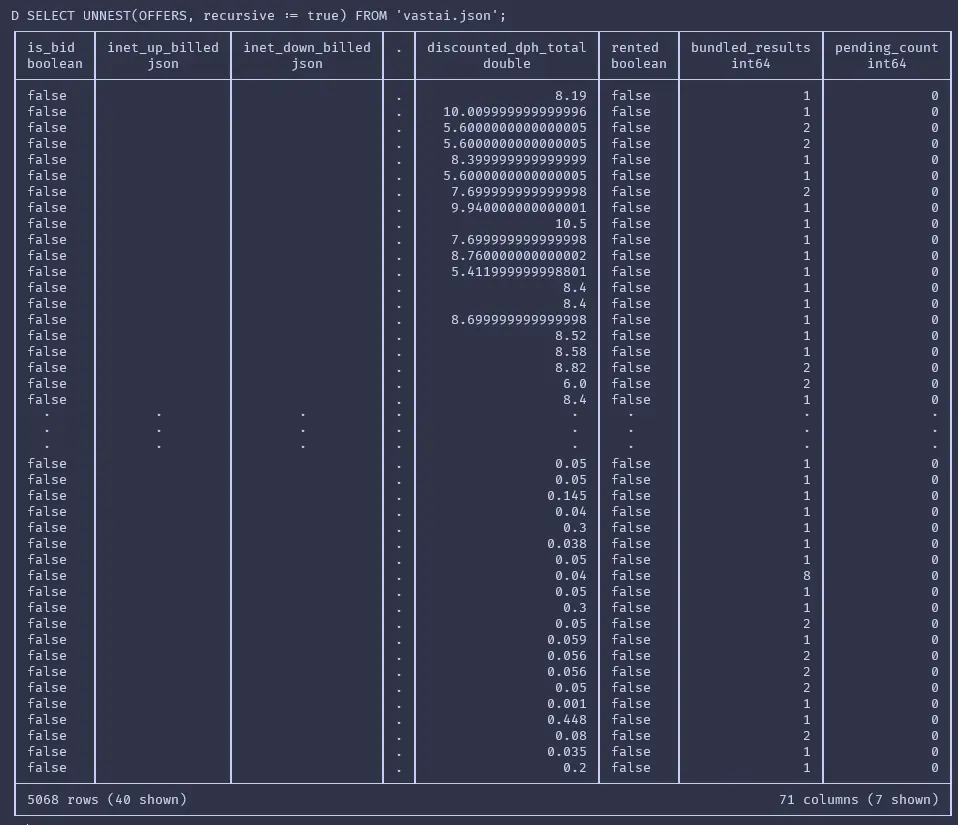
This can be easily solved by using UNNEST. And we need to put on recursive to get it properly unnest it all.
SELECT UNNEST(OFFERS, recursive := true) FROM 'vastai.json';
Ahh.. much better. That UNNEST feature is really powerful.
Once I had that I spent a bit of time exploring the data and comparing it to what I could see on the website. I was never able to fully correlate the price I saw on the website with the prices I saw from the API. They always seemed to be off by a few cents. But I decided close enough was near enough.
I went through and stored the data in tables next:
CREATE TABLE VAST AS
SELECT UNNEST(OFFERS, recursive := true)
	FROM 'vastai.json'
;

CREATE TABLE PERF AS
SELECT *
	FROM 'GpuImagePerformance.csv' -- Where I stored data from Tom's Hardware
;
Then to get the final query I ran:
SELECT Average_Cost
		, ImagesPerMinute
		, (ImagesPerMinute * 60) / Average_Cost IMAGES_PER_DOLLAR
		, GPU_NAME
		, RENTABLE
		, TOTAL
FROM (
	SELECT AVG(dph_total) "Average_Cost"
			, p.ImagesPerMinute
			, GPU_NAME
			, COUNT(CASE WHEN RENTABLE = 1 THEN 1 END) RENTABLE
			, COUNT(*) TOTAL
		FROM VAST v
			JOIN PERF p on lower(v.GPU_NAME) = lower(p.GpuName)
		WHERE verification = 'verified'
			AND num_gpus = 1 -- I don't need multiple for stable diffusion
		GROUP BY *
		ORDER BY 1 desc
)
ORDER BY IMAGES_PER_DOLLAR DESC
I actually stripped out the rentable and total columns after all because they weren’t important and the table was getting squished. Here are the results again:
| Average cost per hour ($) | Images Per Minute | Images per average cost | GPU |
|---|---|---|---|
| 0.10778260869565218 | 26.04 | 14495.845098830172 | RTX 3070 |
| 0.1786 | 41.62 | 13982.082866741319 | RTX 3080 Ti |
| 0.1288 | 29.31 | 13653.726708074533 | RTX 2080 Ti |
| 0.13 | 28.7 | 13246.153846153846 | RTX 3070 Ti |
| 0.20093750000000005 | 37.0 | 11048.211508553652 | RTX 3080 |
| 0.27307692307692305 | 46.85 | 10293.802816901409 | RTX 3090 Ti |
| 0.2656593087016583 | 42.9 | 9689.101475795313 | RTX 3090 |
| 0.15 | 23.71 | 9484.000000000002 | RTX 4060 Ti |
| 0.4755596828767127 | 75.13 | 9478.93642440802 | RTX 4090 |
| 0.35000000000000003 | 51.55 | 8837.142857142857 | RTX 4080 |
| 0.13384000000002 | 17.81 | 7984.160191271968 | RTX 3060 |
| 0.4809400000000001 | 23.3 | 2906.807501975298 | RTX 3060 Ti |
| 0.8 | 31.95 | 2396.25 | Titan RTX |
Conclusion
These results are pretty basic. They don’t take into account many factors such as the rest of the machine’s performance, or even the GPU VRAM available. If I wanted to I could easily add an extra statement to the WHERE clause such as AND gpu_ram >= 12 * 1024 to get all cards where the VRAM is at last 12 GB (in case you were wondering, the 3080 Ti wins in that case).
All in all it was a fun little use of DuckDB to analyze some data quickly. While I could have used other tools to do this, I feel the data ingestion capabilities of DuckDB, coupled with its small file size and ease of use allowed me to get the information I wanted quickly. I do not know how to suggest it to someone who has no or limited SQL knowledge though.